Are you planning a new ferry build? If the answer is yes, then you would probably want to optimise your costs by focusing on the Total Cost of Ownership (TCO) instead of kW-power. Choosing the propulsion unit based mainly on Capex, for example, will most likely increase costs in the long run. In this article we present a case study, showing that a ferry owner can save more than two million euros over a 15-year period by concentrating on the TCO.
The traditional way of handling the procurement of propulsion systems, among other things, is to request quotations for propulsion units based on one specific value, typically kW-power. The one with the lowest price often wins the bid, contributing to lowering the newbuilding unit cost.
However, we need to consider that the cost of a newly built ferry makes up only a fraction of the TCO. A ferry, as well as any other vessel, is designed to be in service for many years. Therefore, it is important to consider the vessel’s purpose and planned operation when choosing the propulsion solution.
Comparing different propulsion system suppliers can be a complicated process when a holistic picture of a ferry’s lifecycle costs is unavailable. For a ferry doing daily repetitive crossings the TCO is what matters the most. The total cost of ownership includes the newbuilding unit cost, maintenance and spare part costs as well as operational energy costs. The current procurement process focusses only on the newbuilding unit cost, even though the energy costs are by far the dominating factor when we talk about TCO.
Simulation-based ferry propulsion design for a 120 CEU double-ended ferry
At Steerprop we decided to examine the TCO impact by doing a simulated case study of some very likely operating scenarios.
We wanted to find out the best ways to design a ferry propulsion system. The example used in the study was a 120 CEU (Car Equivalent Unit) double-ended ferry that would run on four ferry routes of different lengths and crossing times.

Selecting the variables
In addition to the given vessel characteristics, several other variables also need to be decided. These cover project information, propulsor variables and operational variables for the crossing. Among others, these parameters were used:
- Project information. This area covered features such as route length, target crossing time, bollard pull requirement (optional), which are details usually defined by the owner. Ship specific data is then provided by the ship designer, including displacement, resistance curve, thrust deduction and wake fraction.
- Propulsor variables. The following parameters were used for the propulsor: propeller diameter, RPM and pitch design point, and propulsion max power. Secondary variables were auxiliary systems power and lubrication oil temperature.
- Crossing operational variables. When simulating the crossing, these variables were used: manoeuvring time and length at both ends, acceleration time and power, crossing speed (knots), deceleration time, including angle and power of the propulsors. Moreover, the power was split between front and aft units in all modes.
Steerprop was looking for the total energy used for the different crossings (kWh) in the study. This was complemented by combining a specific cost model where attention was given to the energy cost for the crossing (€) and the cost of the propulsion unit (including initial and maintenance costs). For the total cost of ownership, a 15-year period was selected. We also added the possibility to compare different propulsion configurations.
Designing the optimal propulsion unit
How to design the optimal propulsion unit? The answer lies in the balance between Capex (Capital Expenditures) and Opex (Operating Expenses) on the one hand, and the relation between power and torque on the other. For example, a propulsion unit that has better acceleration capabilities or a free running efficiency might cost slightly more but reduces energy consumption significantly. The challenge is to find the best optimal balance. With low power, we gain low Opex, whereas with low torque, we gain low Capex.
It is possible to find the optimal combination of Capex and Opex through studies using both route simulation and cost models.
Operational analysis forms the basis for an optimal TCO
The actual simulation was performed using four ferry routes and three CRP (contra-rotating propellers) propulsion options. The ferry routes, including distances and crossing times used, are shown in Table 1.
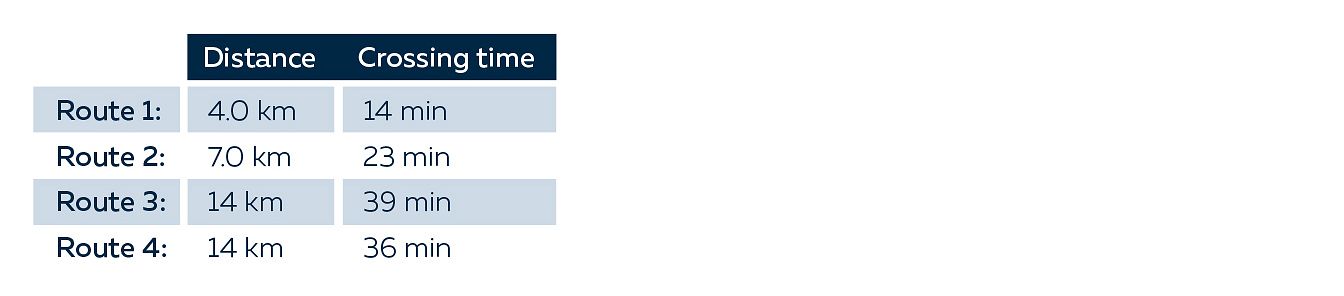
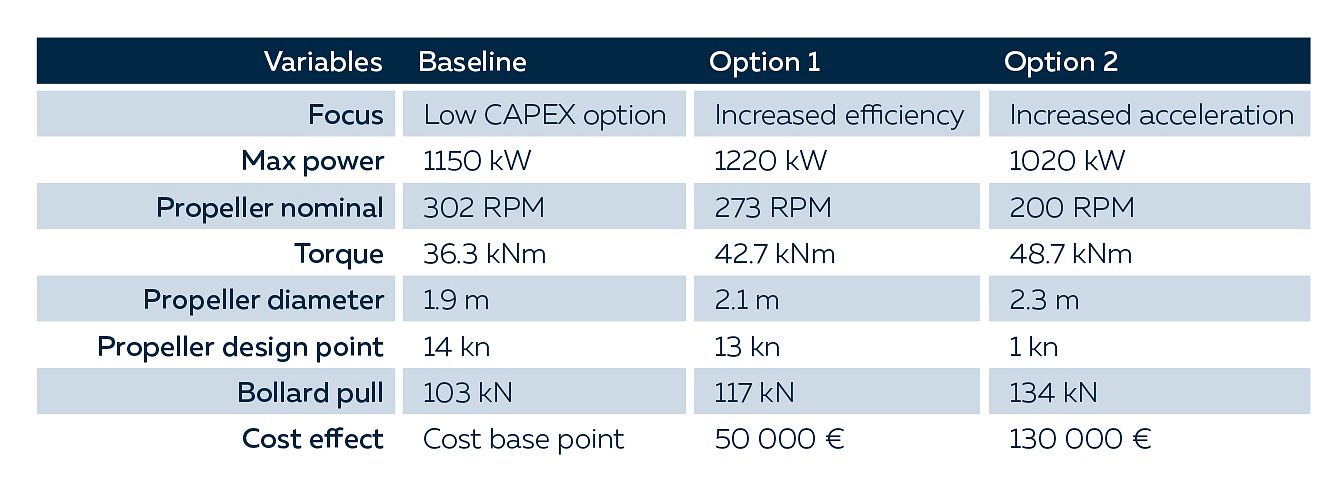
Table 2 above shows that options one and two use a reduced RPM for the propeller and increased torque and an enlarged propeller diameter, among other things. These two options also have a higher Capex, but the results show that there are also substantial annual savings that improve the total cost of ownership.
The results outlined in Figure 2 clearly show that from a TCO perspective, it pays to design propulsion units according to the vessel’s operational profile.
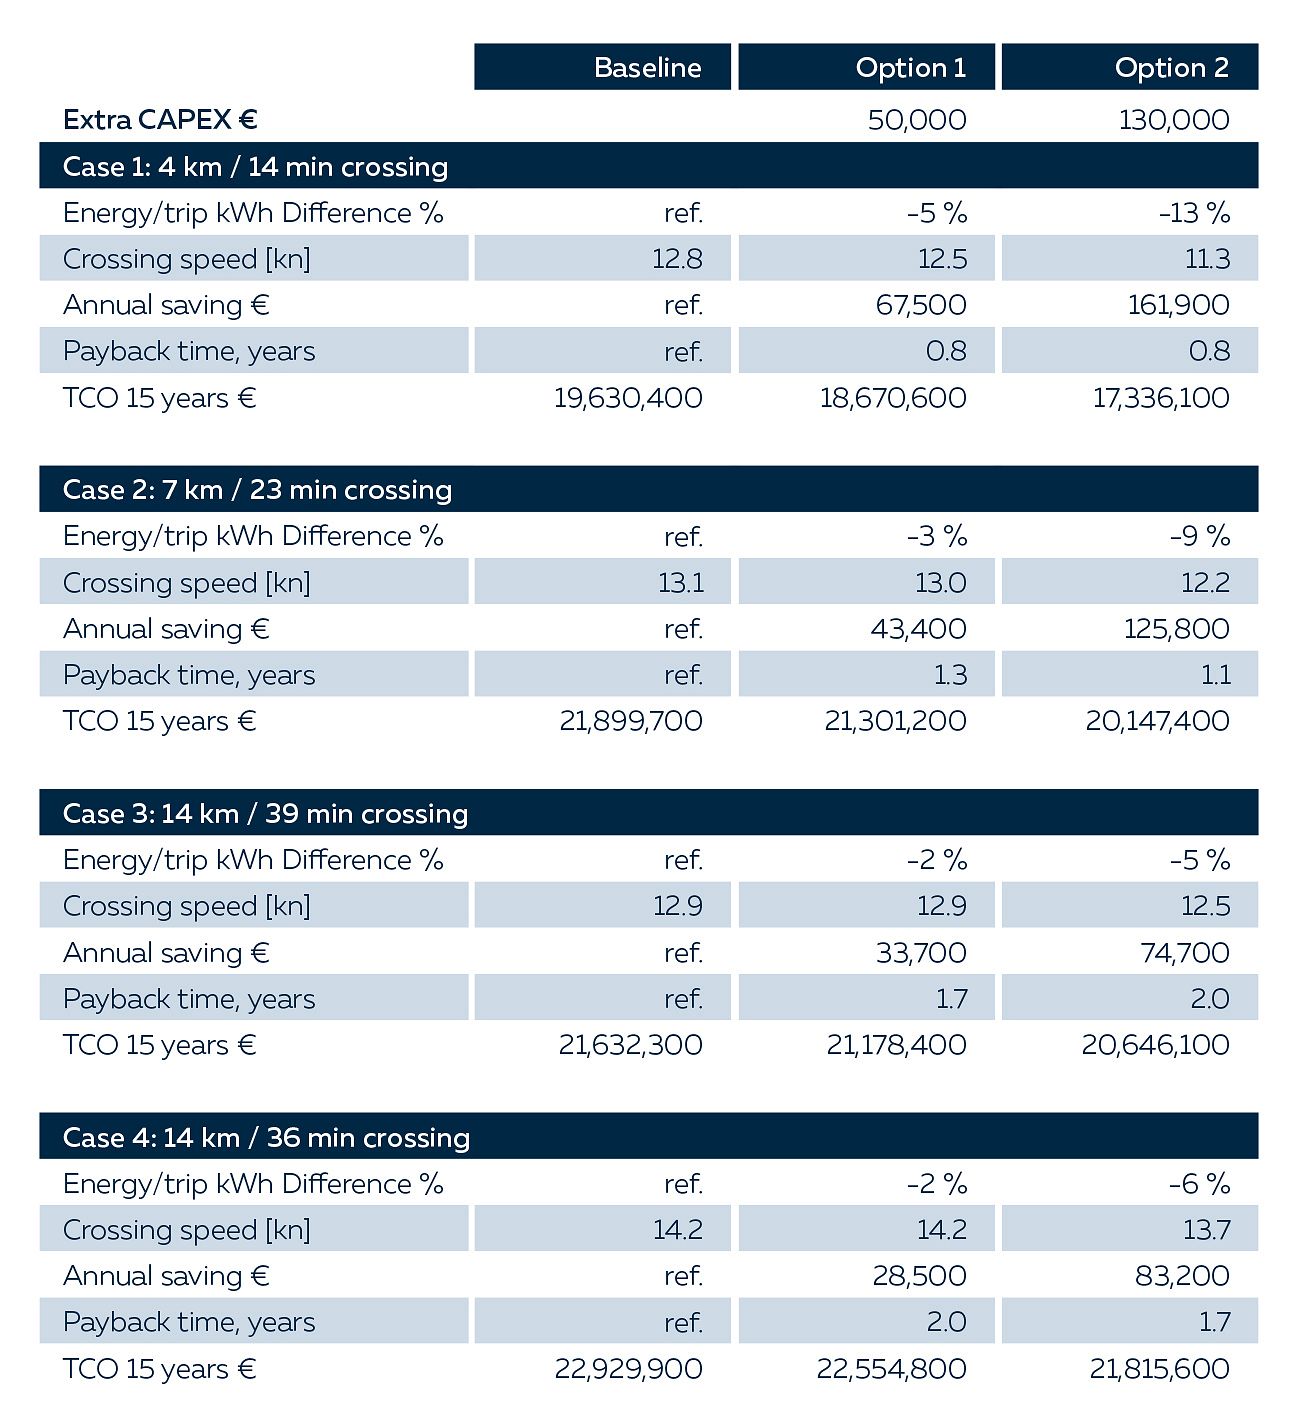
Option two consumes 13% less energy than the “baseline” option on the 14 minute-crossing. We can also see clear annual savings for both options on all ferry routes, which vouches for short payback times, especially on the shorter crossings.
The second option, which focuses on optimising the acceleration phases, benefits ferries operating short crossings where accelerations occur frequently. The total cost of ownership in the 4 km crossing example is slightly over 17,000,000 euros. If we look at annual savings exceeding 160,000 euros, we can see that over a 15-year period, the total savings are more than 2.4 million euros.
The simulation results show that operational analysis is the foundation for finding an optimal total cost of ownership. In addition, significant energy savings can be achieved by involving propulsor design as part of the ship design process.
Contact Steerprop’s experienced propulsion experts to help you find the optimal propulsion solution for your next ferry.
Read more about Steerprop's fit-for-purpose azimuth propulsion solutions.